Task 12026/08/0120260801_t1混合图
The charts below show the land area lost (thousand km²) per one-meter rise and the population (million) affected per one-meter rise in sea level in the predicted future.
Summarise the information by selecting and reporting the main features, and make comparisons where relevant.
Write at least 150 words.
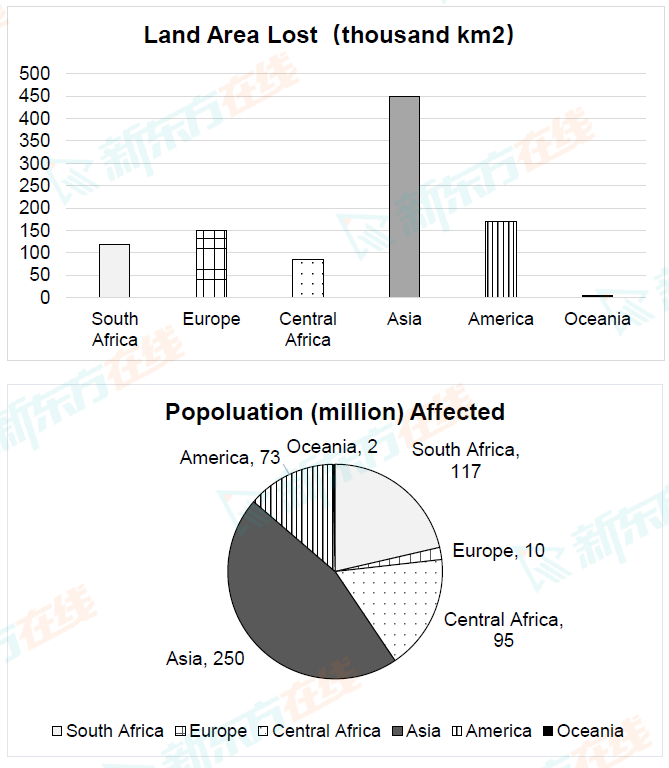
Summarise the information by selecting and reporting the main features, and make comparisons where relevant.
Write at least 150 words.





备考工具
新东方雅思Pro App
扫码下载雅思ProApp
新东方雅思Pro小程序
扫码体验雅思小程序
京ICP备2024050960号-2 信息网络传播视听许可证:0110531 营业执照  京公网安备11010802044296号 ICP许可证编号:京B2-20241156
Copyright © 2024-2024 All Rights Reserved